
Everyone Poops is the title of the American edition of a Japanese children’s book written and illustrated by Tarō Gomi. This post will explain why every business from Tesla to a hot dog stand has churn, just like everyone poops. I decided to use this analogy because both churn and poop are both inevitable and important parts of an essential process. For example, both individual and business customers all die at some point. This is called death churn and is inevitable, just like taxes. I’m not going to take this poop analogy any further since my family was not amused that I have done so at all when I told them of my intentions. They were more pleased with my “everyone has customer acquisition cost and a belly button” idea. I will try to keep this post short, snappy and relatively math free so you don’t get bored.
A churn rate measures of how much of something is lost over a given period. Retention is the inverse of churn. One important type of churn calculation determines how many customers are retained by a business. The simplest explanation of customer churn is visual:

The financial impact of “lost customers” as depicted in the illustration (churn) is too often underestimated by a business.
I’m not going to dig too deeply into the math of churn in this post or the many versions of that math since most of you will stop reading. Let’s just say the math associated with churn can be very complex (or not) and some data scientists (i.e., statisticians who work in a city like San Francisco or Seattle) can spend their entire careers measuring it. Product development, marketing and other people can spend their entire careers trying to improve churn.
Despite my desire to avoid math, I am going to repeat a short explanation of the math of churn from a post by Lighter Capital:
“Customer Churn Rate = Number of preexisting customers who left during a given period / Total customers at the start of that period. For example, assume your company has 50 customers at the beginning of the month. During that month, 12 customers left. That would mean you had a monthly customer churn rate of 24% (12/50 = 0.24). Mathematically, this means churn is the inverse of customer retention.”
The impact of churn, once calculated, is best conveyed graphically:

When it comes to the financial impact of churn, even a fraction of a percentage point change can make a huge difference in an outcome. This is why churn is often tracked in terms of basis points (a hundredth of a percent). A business that ignores even small changes in churn often ends up dead. As with any metric, it is better to be roughly right in calculating churn than to be precisely wrong. It is also important to understand that there are sneaky ways to hide the adverse effects of churn and so you need to be careful with any claims made by promoters based on churn calculations. It is always wise to examine the assumptions that promoters use in a churn calculation since it is possible to tell a very tall tale by misrepresenting the impact of churn. Ben Horowitz writes about hearing this sort of talk from people who want to raise money from his venture capital firm:
“’We have a very high churn rate, but as soon as we turn on email marketing to our user base, people will come back’ – Yes, of course. The reason that people leave our service and don’t come back is that we have not been sending them enough spam. That makes total sense to me, too.”
Going back to the bucket analogy for the impact of churn, if you don’t know how much water is flowing out of the bucket via leaks you have a very incomplete picture of the financial health of a business. Sometimes a business does not reveal its customer churn. For example, I suspect some of the food preparation and delivery startup businesses have very high churn but are not revealing their customer losses. Groupon had punishing churn levels in its early glamorous but highly unprofitable days. The churn rate for some mobile gaming firms and mobile apps is perhaps best measured in hours rather than days.
The higher the customer acquisition cost (CAC) of a given customer the more important lower churn becomes in the unit economics calculation. For example, if you pay $700 in CAC to acquire a satellite TV customer you can’t afford much churn and have positive return on investment. If you pay only $30 to acquire a prepaid cellular customer, churn can be relatively high and yet the business still can make financial sense depending on the other variables that determine unit economics. Here is a short description of why churn matters from a post by Joel York:
“In plain English, you spend an awful lot of money, time and energy acquiring customers. You recover this investment over time, so you want your customers to stick around as long as possible. The longer they stay, the stronger your business. This is why the value of one divided by the churn rate is often quoted as the average customer lifetime; lower churn equals longer customer lifetimes equals larger customer lifetime value.”
Often the math of the unit economics produces a result that makes clear that the benefits of retaining a customers are nonlinear. In short, investments in churn reduction (retention) can yield a far better return on investment than generating new users on a relative basis. There are some research studies that claim that increasing customer retention rates by 5% can increase profits by 25% to 95%.
What is an acceptable churn rate varies by business model and industry. In some cases in some industries it can be wise to require that a customer commit to a contract with a term that is relatively long so as to reduce the risk of churn. The trade off that exists is that services which are not terminable on a monthly basis have higher customer acquisition cost. For example, there is a reason why a service provider does not ask you to commit to a service for five years (answer: it is too expensive in terms of CAC to get you to do so). You must also keep in mind that if the customer is not creditworthy a contract is not worth much anyway. Customer quality matters a lot in thinking about churn. So-called “freemium” services are particularly prone to churn. For example, mobile apps can experience churn that is just short of stunning as depicted in this graph:

No one has ever captured my view of the reflexive nature of unit economics model better than Bill Gurley did in one of his Above the Crowd blog posts:
“Tren Griffin, a close friend that has worked for both Craig McCaw and Bill Gates refers to the five variables of the LTV formula as the five horsemen. What he envisions is that a rope connects them all, and they are all facing different directions. When one horse pulls one way, it makes it more difficult for the other horse to go his direction. Tren’s view is that the variables of the LTV formula are interdependent not independent, and are an overly simplified abstraction of reality. If you try to raise ARPU (price) you will naturally increase churn. If you try to grow faster by spending more on marketing, your SAC will rise (assuming a finite amount of opportunities to buy customers, which is true). Churn may rise also, as a more aggressive program will likely capture customers of a lower quality. As another example, if you beef up customer service to improve churn, you directly impact future costs, and therefore deteriorate the potential cash flow contribution. Ironically, many company presentations show all metrics improving as you head into the future. This is unlikely to play out in reality.”
By watching how a specific “unit economics” model changes as the inputs change you can actually get an analog “feel” for the best ways to create an optimal finance return. Make no mistake: getting the balance right is hard and is an art as much as is it a science, since human emotions and complex adaptive systems are involved. Once you understand the sensitivities of the business/unit economics model to changes in inputs you are better able to answer questions like these if you have a feel for the process:
- Should you deliver more value to customer even if COGS rise?
- Should you increase resources given to the customer retention team?
- Should you focus on acquiring higher quality customers?
In a blog post linked below Sixteen Ventures set out a nice example. If a business wants to have an annual churn rate of 7%, they must keep monthly churn to ~.5 percent, which means only 1 in 200 customers can leave every month. That is not a small challenge in many businesses given the level of competition. Many consumer businesses have 5% customer churn each month. A 5% monthly churn results in a 46% annual churn rate, which means that the business must work hard and spend significant amount of money to replace those customers. Customer replacement requires new CAC, which is expensive. There is nothing bad about acquiring new customers if the unit economics are positive, but too often businesses forget to invest enough in customer retention given the higher return on invested capital from those investments.
If you don’t know the churn of a public business you are considering investing in and they won’t reveal it, the best an investor can do in understanding the unit economics of that business is to look at comparable situations and build in a margin of safety to an estimate. As an example, Netflix no longer reveals churn, but when it did so it looked like this:

You can then take a look at net growth of revenue and customers and roughly calculate a churn rate.
Understanding churn has always been important for a business, but it is even more so today because the challenges associated with attracting and retaining customers have greatly increased. Jeff Bezos understands this new environment well:
“The balance of power is shifting toward consumers and away from companies…the individual is empowered. The right way to respond to this if you are a company is to put the vast majority of your energy, attention and dollars into building a great product or service and put a smaller amount into shouting about it, marketing it. If I build a great product or service, my customers will tell each other. In the old world, you devoted 30% of your time to building a great service and 70% of your time to shouting about it. In the new world, that inverts.”
Almost every customer is “showrooming” (comparing provider prices and quality) using the tools that the Internet and a range of modern hardware devices have made ubiquitously available. The days where a business could take advantage of a wide information asymmetry to earn a higher profit on the sale of a good or service are either rapidly disappearing or are gone. The showrooming phenomenon has resulted in lower gross profit margins and increasing focus on customer retention that often takes the form of a subscription business model and a membership mentality. The theory behind this new approach is simple: by delighting customers on a more regular basis, treating the customers as if they are members of a club and tracking their engagement via a range of metrics, the risk of churn can be reduced. Netflix is an example of a business that has a membership mentality as if Amazon Prime. Another less obvious example is Costco which makes the bulk of its profit on membership fees. The minimally marked up merchandise in Costco stores (~14%), the cheap hot dogs and the free samples are all about delighting customers enough that they renew their membership.
Keeping a customer in today’s hyper-competitive business world is often more profitable than paying to acquire a new customer. This increased focus on customer retention in no small part explains why so many business are shifting to a “lifetime value” approach to valuing customers. Having to re-acquire customers again and again for every transaction is not an ideal way to run a business when customer acquisition costs (CAC) are as high as they are today and customer switching costs are so low. Businesses are as a result focused on delivering nearly constant value to their customers and keeping them engaged and happy. Eric Ries describes the opportunity here:
“…every action you take in service development, in marketing, every conversation you have, everything you do – is an experiment. If you can conceptualize your work not as building features, not as launching campaigns, but as running experiments, you can get radically more done with less effort. Process diagrams [in major corporations] are linear, boxed diagrams that go one way. But entrepreneurship is fundamentally iterative”
Descriptions of a service development process must increasingly look like flywheels. Failure is an essential part of the process which is a feedback loop. The model is: “build, measure, learn” [repeat]. This is the scientific method at work, but systematized with telemetry allowing timely and accurate measurements like never before and cloud computing radically lowering the cost of the experiments.
Customer churn can be separated into sub-types such as: (1) voluntary churn where customers switch to another provider or terminate their use of the product and (2) involuntary churn where a product is no longer provided to the customers due to missed payments, bad debts, etc. There are also plenty of other permutations like gross churn, net churn and cohort churn if you want to go down those roads. There is also revenue churn in addition to user churn for example. Time periods used in the calculation can also vary. Churn can be calculated on a monthly quarterly or annual basis. One post is even entitled: “43 ways to calculate SaaS churn” since there are so many methods for doing the math. There are way more tan 43 but you get the idea. When it comes to the math of churn the Richard Feynman line comes to mind: “The first principle is that you must not fool yourself, and you are the easiest person to fool.”
As an aside, one thing you may encounter is the term: “negative churn.” What drove the creation of this term was the need for a metric that describes increasing revenue from the customers that remain and the term “negative churn” was invented to meet that need. A business has achieved net negative churn: “When, for a given time period, expansion revenue more than offsets any revenue you lose from customer churn, downgrades, lower usage, etc.” I am not fond of the term, but it is out there. It sounds more like up-selling and cross-selling to me. But that is a topic for another post.
In the end, churn is about useful life: how long will the customer relationship last? Here’s a chart of the useful life of mobile customers in about 2009

If churn is defined and tracked properly it can be a powerful motivating and unifying force for a business. A simple metric can result in everyone in effect “rowing together toward a common goal.” Unfortunately, too often “key performance indicators” (KPIs) roughly related to churn are created that vaguely measure engagement. The result is often a hand wavy distraction for the business that is mostly useful for the employee at performance review time. A customer not paying any longer, is a customer not paying any longer. That is what matters.
Other issues must be considered in dealing with churn such as: “for virtually all businesses, new customers will have a higher churn rate than mature customers. But what this means is that some form of segmentation is necessary to have a useful churn rate. For example you may want to only report the churn rate for customers who have been around for at least 90 days. Or you may want separate churn rates for all sorts of demographics and tenure.” This is where the data scientists can really earn their keep. A well-run business with great information about its customers and systems can do things like refer higher value customers to a different level of customer service. A business that knows the customer well can tailor the customer service response to net present value of the stream of income from the specific customer. Having granular data about customers and their lifetime value has never been more important. For example, in the early days of the mobile business we used to know that X dropped calls over a period of Y days, meant risk of churn rose by Z and we would often intervene with a bill credit to stop churn proactively. There are many similar techniques businesses can use to manage and reduce churn. The churn act itself is often the result of a long process that the consultancy Bain argues looks like this:
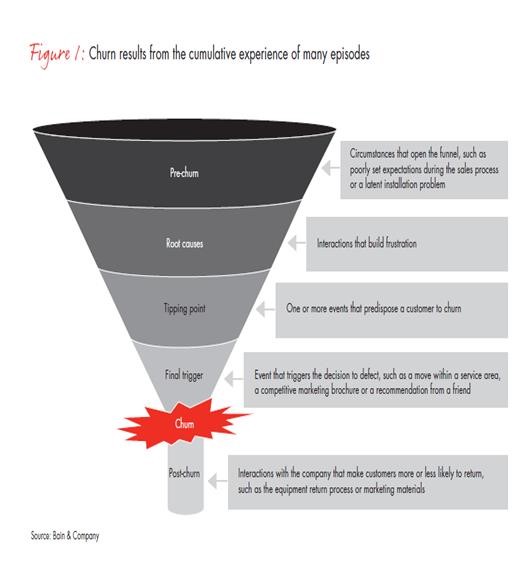
It is true that frustration can build up over time resulting in an eventual churn event of some kind. A situation that results in churn is often a process that is long enough in duration to allow pro-active intervention by a business before the churn event happens. Great analytical systems can go a long way to reducing churn by identifying triggers and ways to reduce customer frustration. A Harvard Business School case linked in the Notes to this post argues:
“By the time you see an increase in your churn rate it is six or eight months after the point in time when you actually failed the customer. If churn is your only measure of customer happiness, then you’re always six months too late to influence your future.” HubSpot and many other firms have developed analytics and accompanying metrics to predict who is going to leave. “The most innovative firms are using churn rate analysis as an opportunity to get ahead of losing customers rather than just accept it.”
To close this post (since this post is running long at ~3,000 words), I will point you to work done by Pacific Crest, which has a well-known survey in which they track churn in the software as a service (SaaS) business, and one of their charts look like this:

There are many more useful charts in the links in the Notes. If you want to dig into churn mathematics and methodology there many other resources available.
A Dozen Notes:
- 2026 Pacific Crest Survey: http://www.forentrepreneurs.com/2016-saas-survey-part-2/
- Joel York- What is Churn: http://chaotic-flow.com/saas-metrics-faqs-what-is-churn/
- TechCrunch: https://techcrunch.com/2015/10/05/easily-measure-the-profitability-of-your-consumer-subscription-business/
- Sixteen Ventures: http://sixteenventures.com/saas-churn-rate
- Bill Gurley: http://abovethecrowd.com/2012/09/04/the-dangerous-seduction-of-the-lifetime-value-ltv-formula/
- Consultants! Booz: http://www.boozallen.com/content/dam/boozallen/media/file/customer_churn_insights.pdf PWC: http://www.strategyand.pwc.com/media/file/Strategyand_Customer-Value-Management.pdf
- HBS! http://www.forbes.com/sites/hbsworkingknowledge/2013/11/11/a-smarter-way-to-reduce-customer-churn/#96bd49a9ac71 HBS: http://www.hbs.edu/faculty/Publication%20Files/14-020_3553a2f4-8c7b-44e6-9711-f75dd56f624e.pdf HBS https://hbr.org/2014/10/the-value-of-keeping-the-right-customers
12. Horowitz: http://www.bhorowitz.com/lies_that_losers_tell
- Why is it so Hard to Forecast the Future?
- Gross Margin for Fun and Profit – Involves Beer and Music Streaming!
Categories: Uncategorized